This video explains the some of the excel Functions and Features in Tamil.
Watching this tutorial give a a good understanding of the Frequency Formula in and the alternative usage of Frequency formula with other fantastic Excel Features such as Histogram Chart and Pivot Table.
SUBSCRIBE TO THIS CHANNEL
https://youtube.com/prabasmsoffice/?sub_confirmation=1
Make sure to download and use the practice file from the following path for better understanding:
https://prabastech.com/excel-function-and-features/
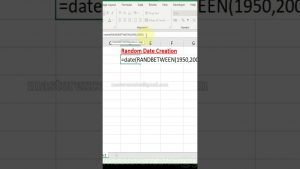
Frequency Formula – The FREQUENCY function returns a vertical array of integers after calculating how often values occur within a range of values. Use FREQUENCY, for example, to count the number of test scores that fall inside certain limits. FREQUENCY must be entered as an array formula because it returns an array.
Pivot Table – A PivotTable is a powerful tool for calculating, summarising, and analysing data, allowing you to spot similarities, patterns, and trends.
Histogram Chart – A histogram is a column chart that displays data in terms of frequency. You need two sorts of data to make a histogram in Excel: the data you want to analyse and the bin numbers that reflect the intervals you want to measure the frequency by. The data must be organised in two columns on the spreadsheet. The following information must be included in these columns:
#FrequencyExcelFormula
#HistogramExcelChart
#PivotTableGrouping
Join us to show your love and support: https://www.youtube.com/channel/UCE37kYsUhsxDB0-IlB6zwMQ/join
Topics Covered in this video:
0:00 – Introduction of Frequency Formula vs Histogram Chart vs PivotTable
0:41 – Using Frequency Formula
4:01 – Using Histogram Chart
5:44 – Using Pivot Table
All Videos of Prabas Microsoft Office in Tamil – தமிழ்: https://www.youtube.com/watch?v=w1QvylCR9TI&list=PLXqX9fbIzJMboP2SYGh-sGft3Vi6H8RGH
#Histogram #Chart
#PivotTable
#Freqnency #Excel #Formula
#PrabasMSOffice
#PrabasTech
#PowerQuery
#FreeDownloads
#Office365